IT infrastructure grows — and so does its complexity. Servers, firewalls, storage systems, and network components are distributed across multiple locations. Anyone manually monitoring and patching 50 systems spends hours on repetitive tasks while still missing critical updates. DATAZONE Control centralizes monitoring, patch management, and configuration in one platform — self-hosted, without cloud dependency.
The Problem: Decentralized IT Administration
A typical SMB with 3 locations operates:
- 10–20 Proxmox hosts with VMs and containers
- 3–6 OPNsense firewalls
- 2–4 TrueNAS storage systems
- Various Linux servers (web servers, mail servers, databases)
Without central management, this means:
- SSH into every server individually to check for updates
- Open each firewall’s web interface separately
- No unified overview of overall health
- Inconsistent patch levels between locations
- Delayed response to critical security updates
DATAZONE Control: The Central Hub
DATAZONE Control is a self-hosted platform for centralized management of heterogeneous IT infrastructure. An agent on each managed system reports status information and receives tasks.
Architecture
┌──────────────────────────────┐
│      DATAZONE Control        │
│      (Self-Hosted Server)    │
├──────────────────────────────┤
│  Dashboard · Monitoring      │
│  Patch Management · Scripts  │
│  Asset Inventory · Alerting  │
└──────────────┬───────────────┘
               │
    ┌──────────┼──────────┐
    ▼          ▼          ▼
┌────────┐ ┌────────┐ ┌────────┐
│ Site A │ │ Site B │ │ Site C │
│        │ │        │ │        │
│Proxmox │ │Proxmox │ │OPNsense│
│OPNsense│ │TrueNAS │ │Linux   │
│TrueNAS │ │Linux   │ │Servers │
└────────┘ └────────┘ └────────┘
Each system runs a lightweight agent that:
- Collects system information (CPU, RAM, disk, network)
- Reports installed packages and versions
- Detects available updates
- Receives and executes scripts and tasks from the control server
- Sends status reports at configurable intervals
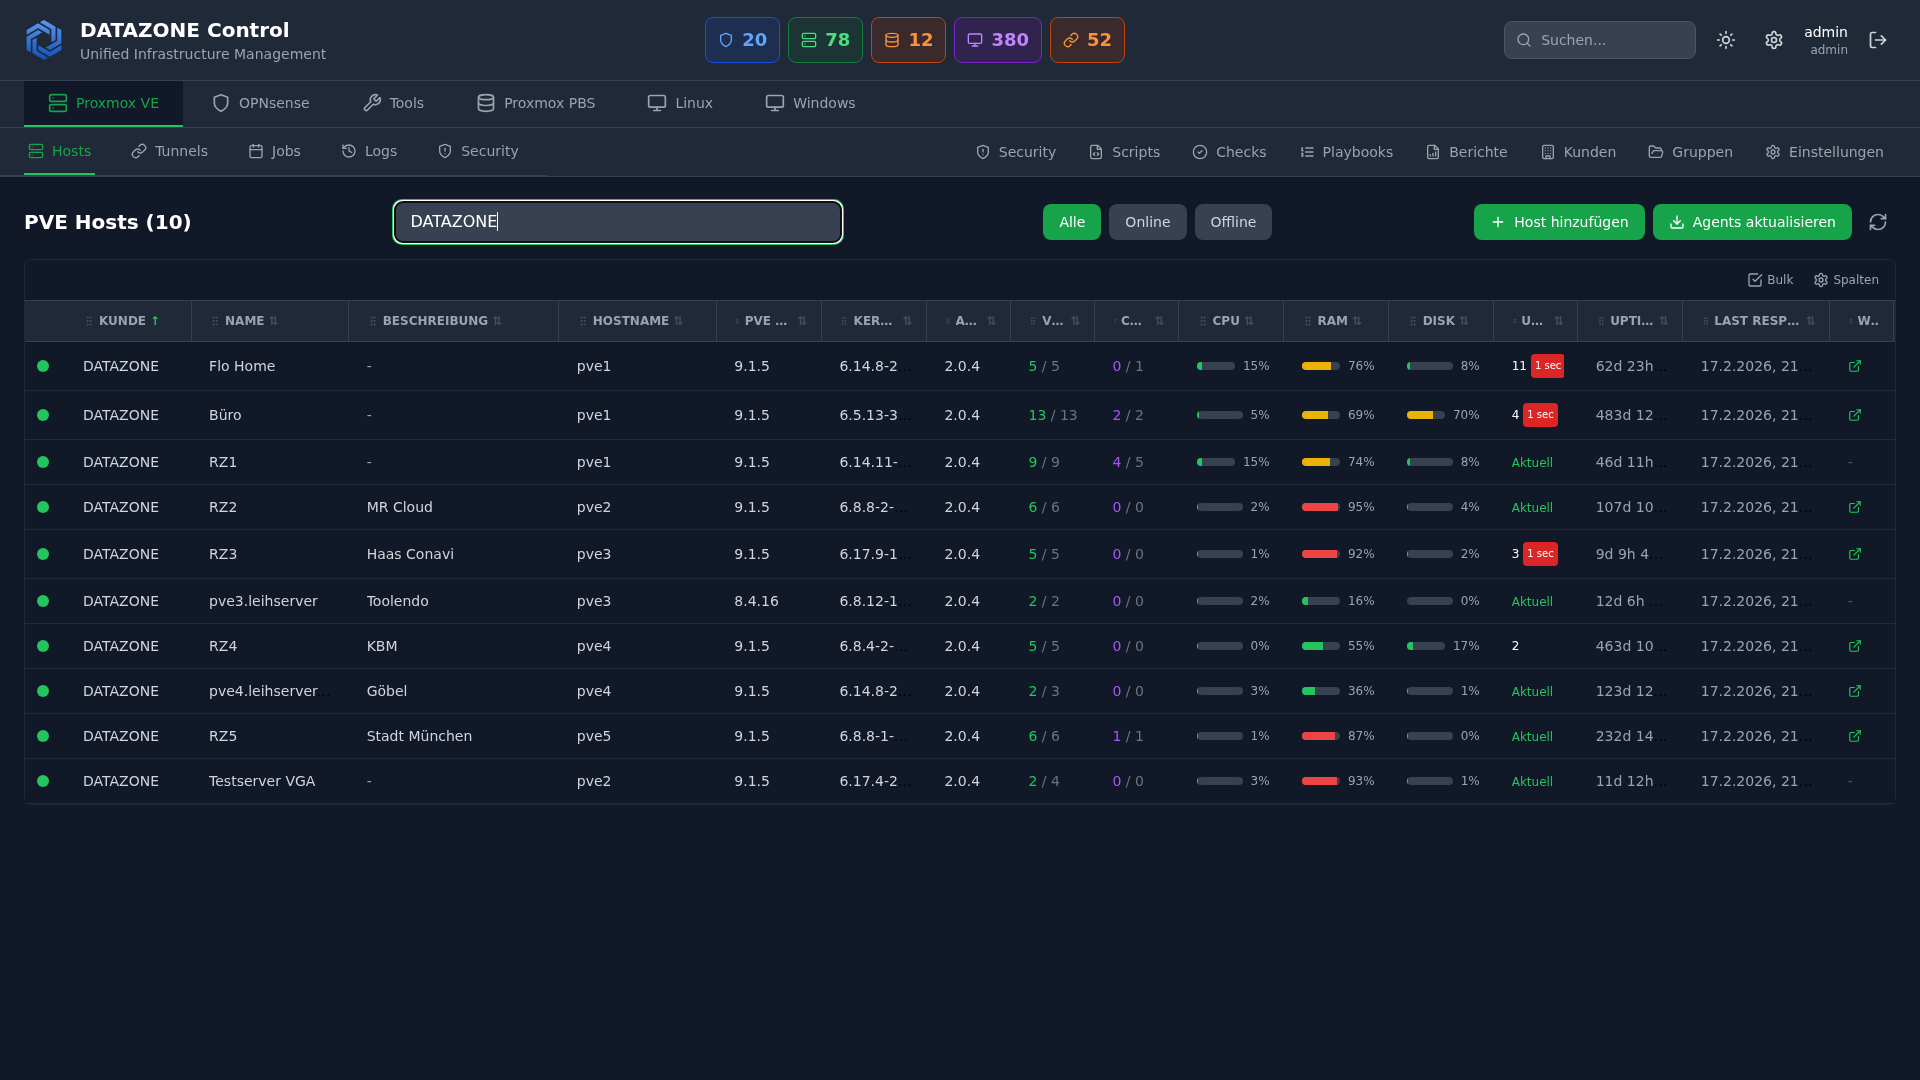
Monitoring: Everything at a Glance
System Monitoring
DATAZONE Control monitors for each system:
| Metric | Description | Alert Threshold |
|---|---|---|
| CPU utilization | Average and peaks | > 90% for 5 minutes |
| RAM usage | Used, cache, swap | > 85% used |
| Disk capacity | Per partition/pool | > 80% used |
| Disk health | SMART status | Any error |
| Network traffic | In/out per interface | Anomaly detection |
| Uptime | Since last reboot | Unplanned restart |
| Service status | Systemd services | Service not active |
Proxmox-Specific
For Proxmox hosts additionally:
- VM/CT status: Which VMs and containers are running, which are stopped
- Cluster quorum: Are all nodes in the cluster reachable
- Ceph health: Status of distributed storage (if Ceph is in use)
- Backup status: Latest PBS backups and their results
- HA status: High availability groups and failover readiness
OPNsense-Specific
For OPNsense firewalls:
- Firewall rules: Number of active rules, last change
- VPN tunnels: Status of all IPsec/WireGuard tunnels
- IDS/IPS alerts: Suricata alerts aggregated
- Blocklist status: Are all alias tables loaded
- Update availability: OPNsense version status
Alerting
Alerts are triggered for:
- Threshold exceeded on defined metrics
- System unreachable (no heartbeat)
- Available security updates (by severity)
- Failed backups
- Disk SMART warnings
Notification channels: Email, webhook, integration with existing monitoring systems.
Patch Management: Central and Auditable
Overview Across All Systems
The patch dashboard shows:
- Systems with pending updates (grouped by severity)
- Security-relevant updates highlighted
- Patch compliance per location (percentage of current systems)
- Update history for audit and traceability
Patch Workflow
- Detection: Agents report available updates automatically
- Assessment: Updates are classified by severity (critical, high, medium, low)
- Approval: IT administrator reviews and approves updates in the dashboard
- Execution: Updates are deployed to selected systems or groups
- Validation: Agent reports result — success or failure
- Documentation: Complete audit log of all performed updates
Patch Groups
Systems can be organized into groups:
- Test group: Test updates here first (one representative server)
- Production Site A: Roll out after successful testing
- Production Site B: Staggered after Site A
- Firewalls: Separate group with its own approval level
Example: Kernel Update on 15 Linux Servers
Without DATAZONE Control:
- SSH into server 1,
apt update && apt upgrade, wait, reboot - SSH into server 2, same thing…
- …repeat for 15 servers
- Verify all services are running again
- Time required: ~3 hours
With DATAZONE Control:
- Dashboard: “15 servers with available kernel update”
- First test group: update 1 server, validate
- Select all remaining servers, start update
- Monitor status in real-time, all services are checked automatically
- Time required: ~15 minutes
Script Execution: Configuration Management
Beyond monitoring and patches, DATAZONE Control can execute arbitrary scripts on managed systems:
- Configuration changes across all systems simultaneously
- Compliance checks (CIS hardening, security audits)
- Automated setups (blocklists, agent configurations)
- Data collection (inventory, license status)
Scripts are centrally managed, versioned, and executed with logging. Every execution is recorded — who ran what, when, on which system.
Self-Hosted: Full Control
DATAZONE Control runs on your own infrastructure — no cloud dependency, no third-party access.
Advantages over cloud RMM:
- Data sovereignty: All data stays in your network
- No vendor lock-in: No monthly SaaS fees
- GDPR compliance: No data transfers to third parties
- No internet requirement: Works in air-gapped networks too
- Customization: Adaptable to specific requirements
Frequently Asked Questions
Which operating systems are supported?
The DATAZONE Agent runs on Debian, Ubuntu, CentOS, Rocky Linux, Alpine Linux, FreeBSD (OPNsense), Proxmox VE, and TrueNAS. Windows support via a separate agent.
How does the agent communicate with the control server?
Encrypted via HTTPS. The agent initiates the connection to the control server (pull model) — no inbound firewall ports needed on managed systems.
Can DATAZONE Control replace existing monitoring systems?
For most SMBs, yes — DATAZONE Control covers system monitoring, patch management, and script execution. For complex monitoring requirements (application performance monitoring, custom dashboards), it can additionally be connected to Prometheus/Grafana or Zabbix.
What happens if the control server goes down?
Managed systems continue running independently — the agent has no influence on operations. Monitoring data is buffered locally and synchronized after connection is restored.
Want to centrally manage your IT infrastructure? Contact us — we set up DATAZONE Control and integrate all your Proxmox, OPNsense, and TrueNAS systems.
More on these topics:
More articles
MFA Methods: TOTP vs. FIDO2 vs. Push — Which for SMBs?
MFA comparison for SMBs: TOTP, FIDO2 and push notifications in practice. Phishing resistance, cost, and rollout with Authentik or Keycloak.
Samba as Active Directory: Replacing a Windows Domain
Replace Windows Server AD with Samba 4 AD-DC: BIND9 DNS integration, replication, group policy limits and coexistence during migration.
Bash vs. Ansible: When the Jump Is Worth It
Bash scripts or Ansible for your server automation? When idempotency, inventory and playbook reuse actually pay off for growing Linux environments.